IBM i Performance Issues and Degradation
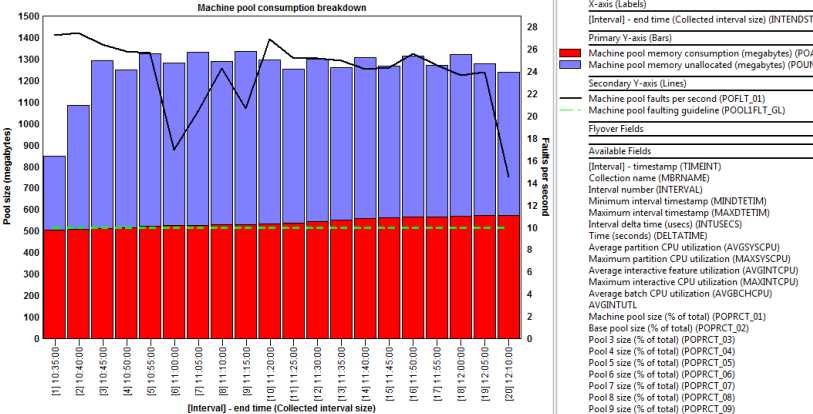
Upgrading the IBM i Power system main storage is a cheap and quick solution to stop high page faulting rates due to insufficient memory or when too many jobs or threads are fighting for memory resources. You can view the memory storage pools and to see if the faults per second is greater than 10. Adding more disk arms or upgrading HDD to IBM SSD for a particular workload type may be the solution when disk utilization is greater than 40% and system wait or service times are unacceptable. It is not even that uncommon for a company to experience performance issues on a brand new system or after performing an OS400 or application upgrade.
The IBM i has many tools you can use to analyze and monitor the performance of your iSeries Power system, including Job Watcher, Disk Watcher, Performance Tools, Navigator or even using WRKSYSSTS, WRKSHRPOOL, WRKDSKSTS and WRKACTJOB commands. For a quick and simple report, start a performance trace using STRPFRTRC command during peak hours or when the degradation is occurring, and view the system and components report to identify the bottlenecks in the trace table QPM_STRPFRTRC created.
A performance analyst tuning your system resources may need to understand the symptoms better and require collecting additional statistics before making any recommendations. After the performance assessment is completed, the analyst can then use tools to measure the degree of success of the proposed changes without even touching the system, and hopefully determine any possible negative side effects as a result. In the end, it may be an application code change recommendation versus hardware.
If you do decide to experiment and customize your iSeries performance settings, make sure to only make one change at a time, keep good notes, and monitor the performance results of all workload types closely:
- interactive throughput, response times and CPU utilization
- batch throughput, auxiliary input/output and CPU utilization
- spool file throughput, auxiliary input/output and CPU utilization
The time you invest in identifying and fixing your performance issues, may be a lot more than the cost of the hardware you need. For more help identifying and resolving performance issues on your iSeries, check out the performance system values on your iSeries and read IBM’s recommendations.